Where is AI capability headed, and how do we measure it?
An interview with Håvard Tveit Ihle, AI researcher at the Norwegian Defence Research Establishment (FFI) and creator of the WeirdML benchmark.
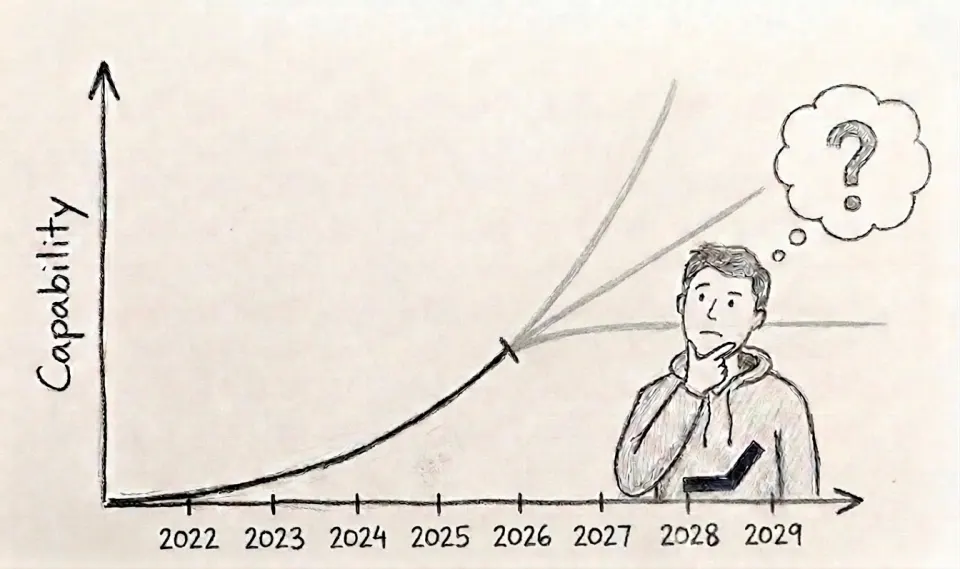
You have probably had this experience: You ask Claude or ChatGPT to do something, and it produces an answer that is genuinely brilliant. Then, ten minutes later, the same AI model makes a mistake a child would not make.
Håvard Tveit Ihle knows this feeling better than almost anyone, and so he calls the current generation of AI models “spiky.” He has spent the past years testing the most capable ones in existence, and he means the word fairly literally: excellent on one task, then wrong about something a ten-year-old would get right, with little warning about which you are going to get. It is the main reason, he says, to be careful about reading too much into any single benchmark score.
Ihle is well placed to make that judgement. He went from a PhD in cosmology at the University of Oslo, for which he won the King’s Gold Medal for best doctoral thesis, to studying the AI models now being used to study almost everything else. Today he works on AI evaluation and interpretability at FFI, Norway’s defence research institute. He also built and runs WeirdML, a benchmark now used by Epoch AI and funded in part by METR, two of the most respected names in independent AI evaluation.
The views expressed in this interview are Ihle’s own, and do not represent the views of FFI.
We spoke to him about what a benchmark actually measures and why it may be getting harder to benchmark AI models in the future. We also got into how a normal person should read the numbers that keep showing up in headlines, and at last where the capabilities of AI actually may be heading.
1. What a benchmark actually is
Lets start with the simplest possible version: You write a thousand questions and you know the correct answer to every one. You give them to an AI model and it gets 812 right. That is 81.2 percent, which is a benchmark score. Its really nothing more mysterious than a school exam.
A benchmark is a collection of tasks given to a model in order to measure one capability, or a few, within a fairly narrow and specific type of task. The last part matters, Ihle says. A benchmark does not tell you whether a model is good. It tells you whether a model is good at the particular kind of thing that benchmark happens to contain.
The benchmarks that defined the early years of the field were mostly multiple-choice knowledge tests, designed to probe what a model knew. In our previous blog post we talked with Øyvind Tafjord who helped build one of those at the Allen Institute: the original ARC benchmark, a set of grade-school science questions in multiple-choice format, which in 2018 was a serious challenge.
Today, Ihle says, that whole category of benchmarks are becoming obsolete. The focus has moved to what the field calls agentic tasks, which may look more like how a human works: using different tools, using a computer, working through problems that take many steps and have no single clean answer. But now, what does the number from these benchmarks actually tell you?
2. A benchmark is a sensor
Ihle’s answer, developed with fellow researcher Mathias Bynke, is to think of a benchmark as a sensor with a sensitivity range, not unlike a physical instrument which we use in our everyday lives.
Think of a bathroom scale that only reads between 60 and 80 kilos. Below 60 it shows zero, above 80 it pins at the top, but inside that window it is precise. However, outside the window it is useless, it still looks like it is working.
Benchmarks behave the same way. Give a hard benchmark to a model that is far too weak and every task is out of reach, so everything scores near zero. The benchmark cannot tell the difference between bad and catastrophically bad. Give it to a model that is far too strong and every task is easy, so everything scores near 100 percent, and it cannot tell very good from excellent. Only in the middle, where the difficulty roughly matches the model’s ability, does the score resolve real differences.
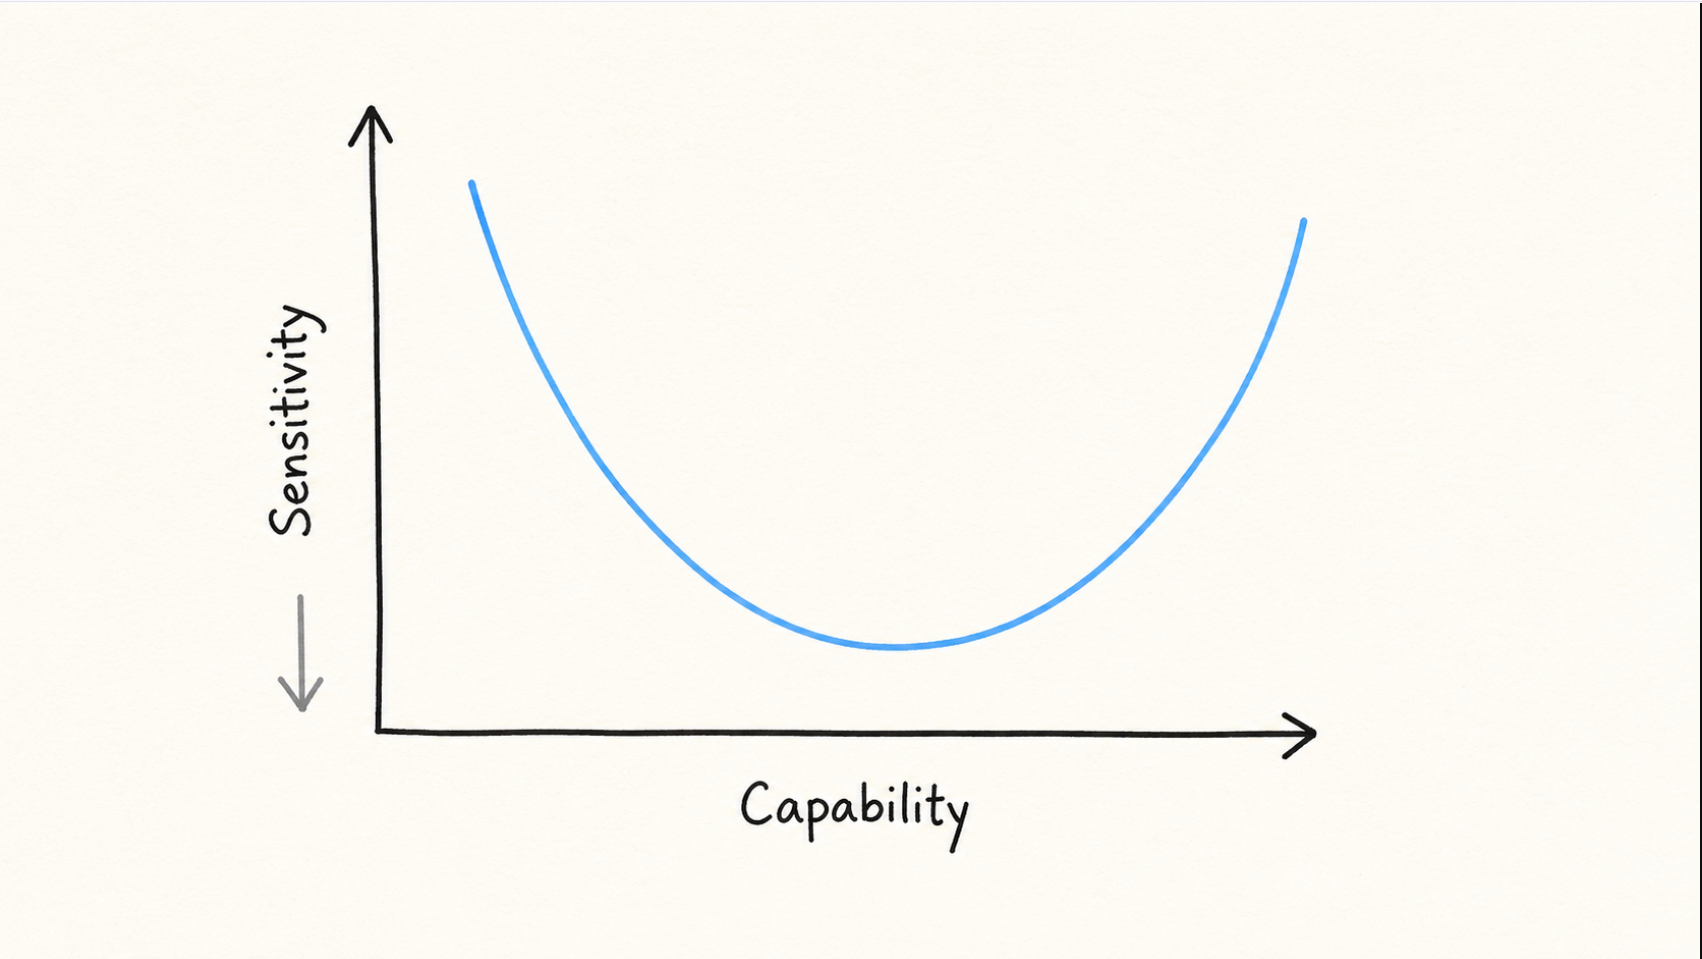
This is what people mean when they say a benchmark has become saturated. The models have climbed past the top of the sensor’s range. It has run out of room to tell good from better, and its scores stop carrying information.
3. Why scoring is the hard part
Multiple-choice questions are easy to grade, there is a correct answer and you check it. Most interesting modern tasks that look more like human work are not like that at all.
Code is the clearest example. There are many ways to solve a programming problem, some elegant and some awful. The standard approach is to write a suite of tests, including some the model never sees, and check whether the code passes them. That tells you the code does not visibly break, but tells you nothing about whether the code is any good.
For genuinely open-ended work, writing, judgement calls, anything without a single right answer, the common workaround is to use another AI model as the judge. Ihle is blunt about the problem. It makes it “a lot easier to get a score on almost anything,” and that is exactly the danger. The model being tested can start optimising for whatever the judge model rates highly rather than for what is actually good.
Teachers will recognise this immediately. If the exam is all that counts, students learn to write what earns marks, which is not quite the same as learning the subject. In machine learning the same failure has a name; reward hacking, and it turns up in training as well as in testing. A model scored by an imperfect signal will learn to satisfy the signal rather than solve the problem underneath it.
The tasks Ihle personally finds most interesting are the ones with no automatic way to score them at all. The ambiguous, open-ended problems you would hand to a colleague rather than to a test-taker. That is the kind of work closest to how AI actually gets used day to day, and it is the kind that is hardest to build a benchmark around.
4. Almost nobody can build these any more
A few years ago, running a benchmark was cheap. You needed a few thousand multiple-choice questions and a tiny amount of computing power. In Ihle’s words, “you used A, B, C and D, the model read a short question and emitted a single letter as its answer”.
Now a single hard task can involve hundreds of thousands, sometimes millions, of output tokens. A token is roughly a fragment of a word, the unit models read and write in, and you pay for every one of them. Agentic tasks need a sandboxed environment to run inside, and some may need a dedicated graphics card allocated for the duration of the test. Runs take hours instead of seconds. To make it even more comlicated, a single run of a single model tells you very little, so you have to repeat the whole thing several times before the average means anything.
Based on this Ihle’s assessment is that it is now genuinely hard for anyone without serious resources to build a good benchmark and run it properly, and he expects that to keep getting worse. The measurement of frontier AI is becoming something only well-funded institutions can do.
His own benchmark, WeirdML, gives models genuinely novel machine learning problems: recognising shapes in noisy point clouds, predicting chess outcomes from move sequences, reassembling shuffled image patches. The model has to understand the data, write working code, and then improve it across five scored attempts, using terminal output and test accuracy as feedback between tries.
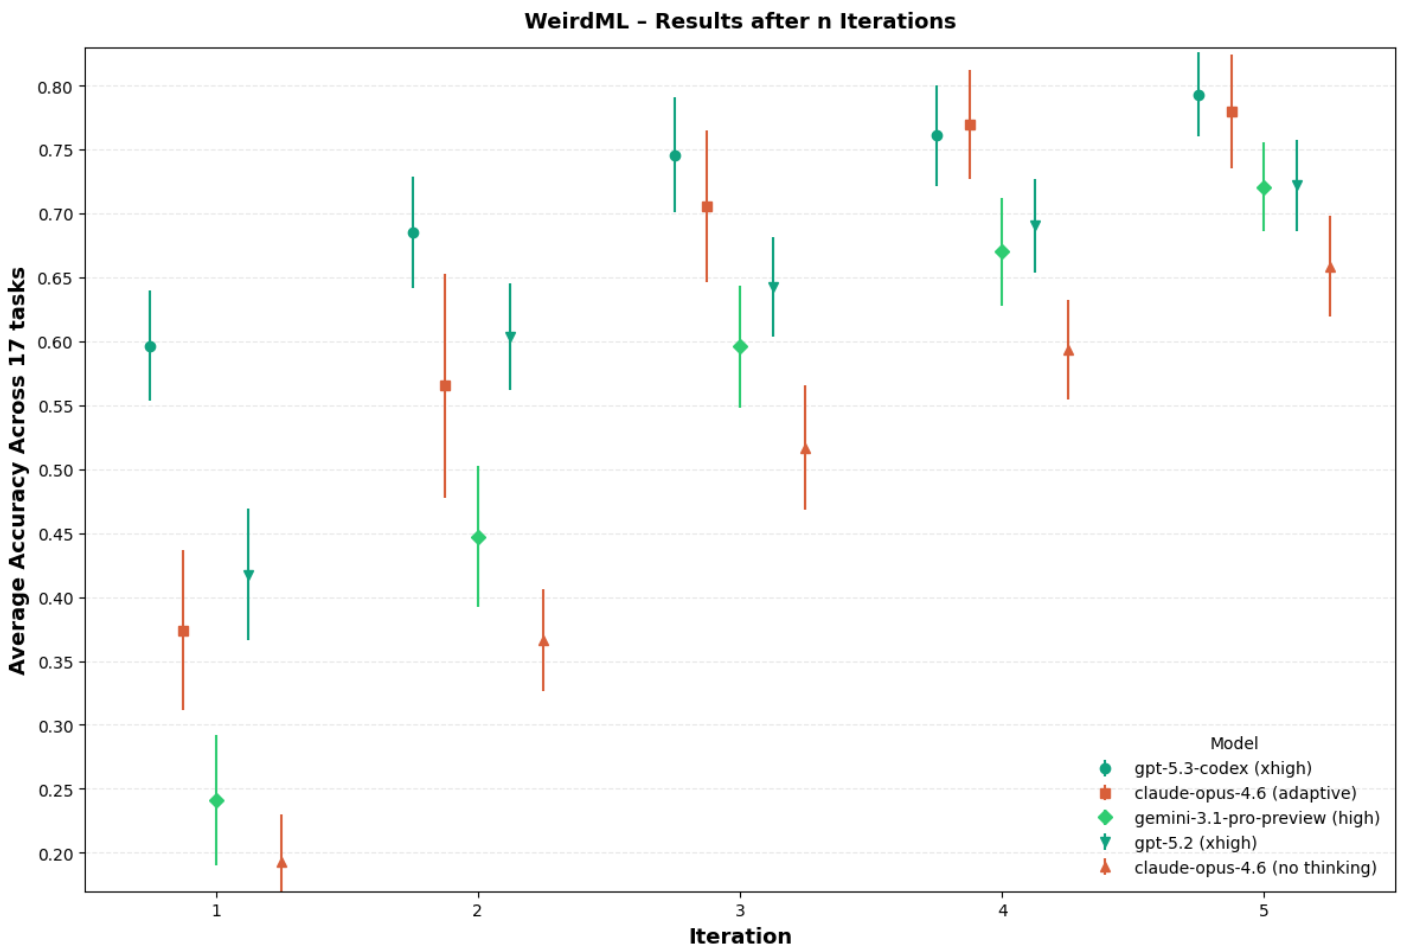
Many tasks used in the benchmark are deliberately kept unpublished, so a model cannot have quietly learned the answers from the internet during training. Every model is run five times per task, because the variation between runs of the same model on the same task is large enough that a single run is close to meaningless.
5. How to track progress
If benchmarks keep saturating, and they do, how does anyone track progress across more than a couple of years?
What you would really want, Ihle says, is a single benchmark that could measure everything from the earliest and dumbest text models all the way up to whatever exists many years from now. No such single benchmark exists, and it is not obvious that one could.
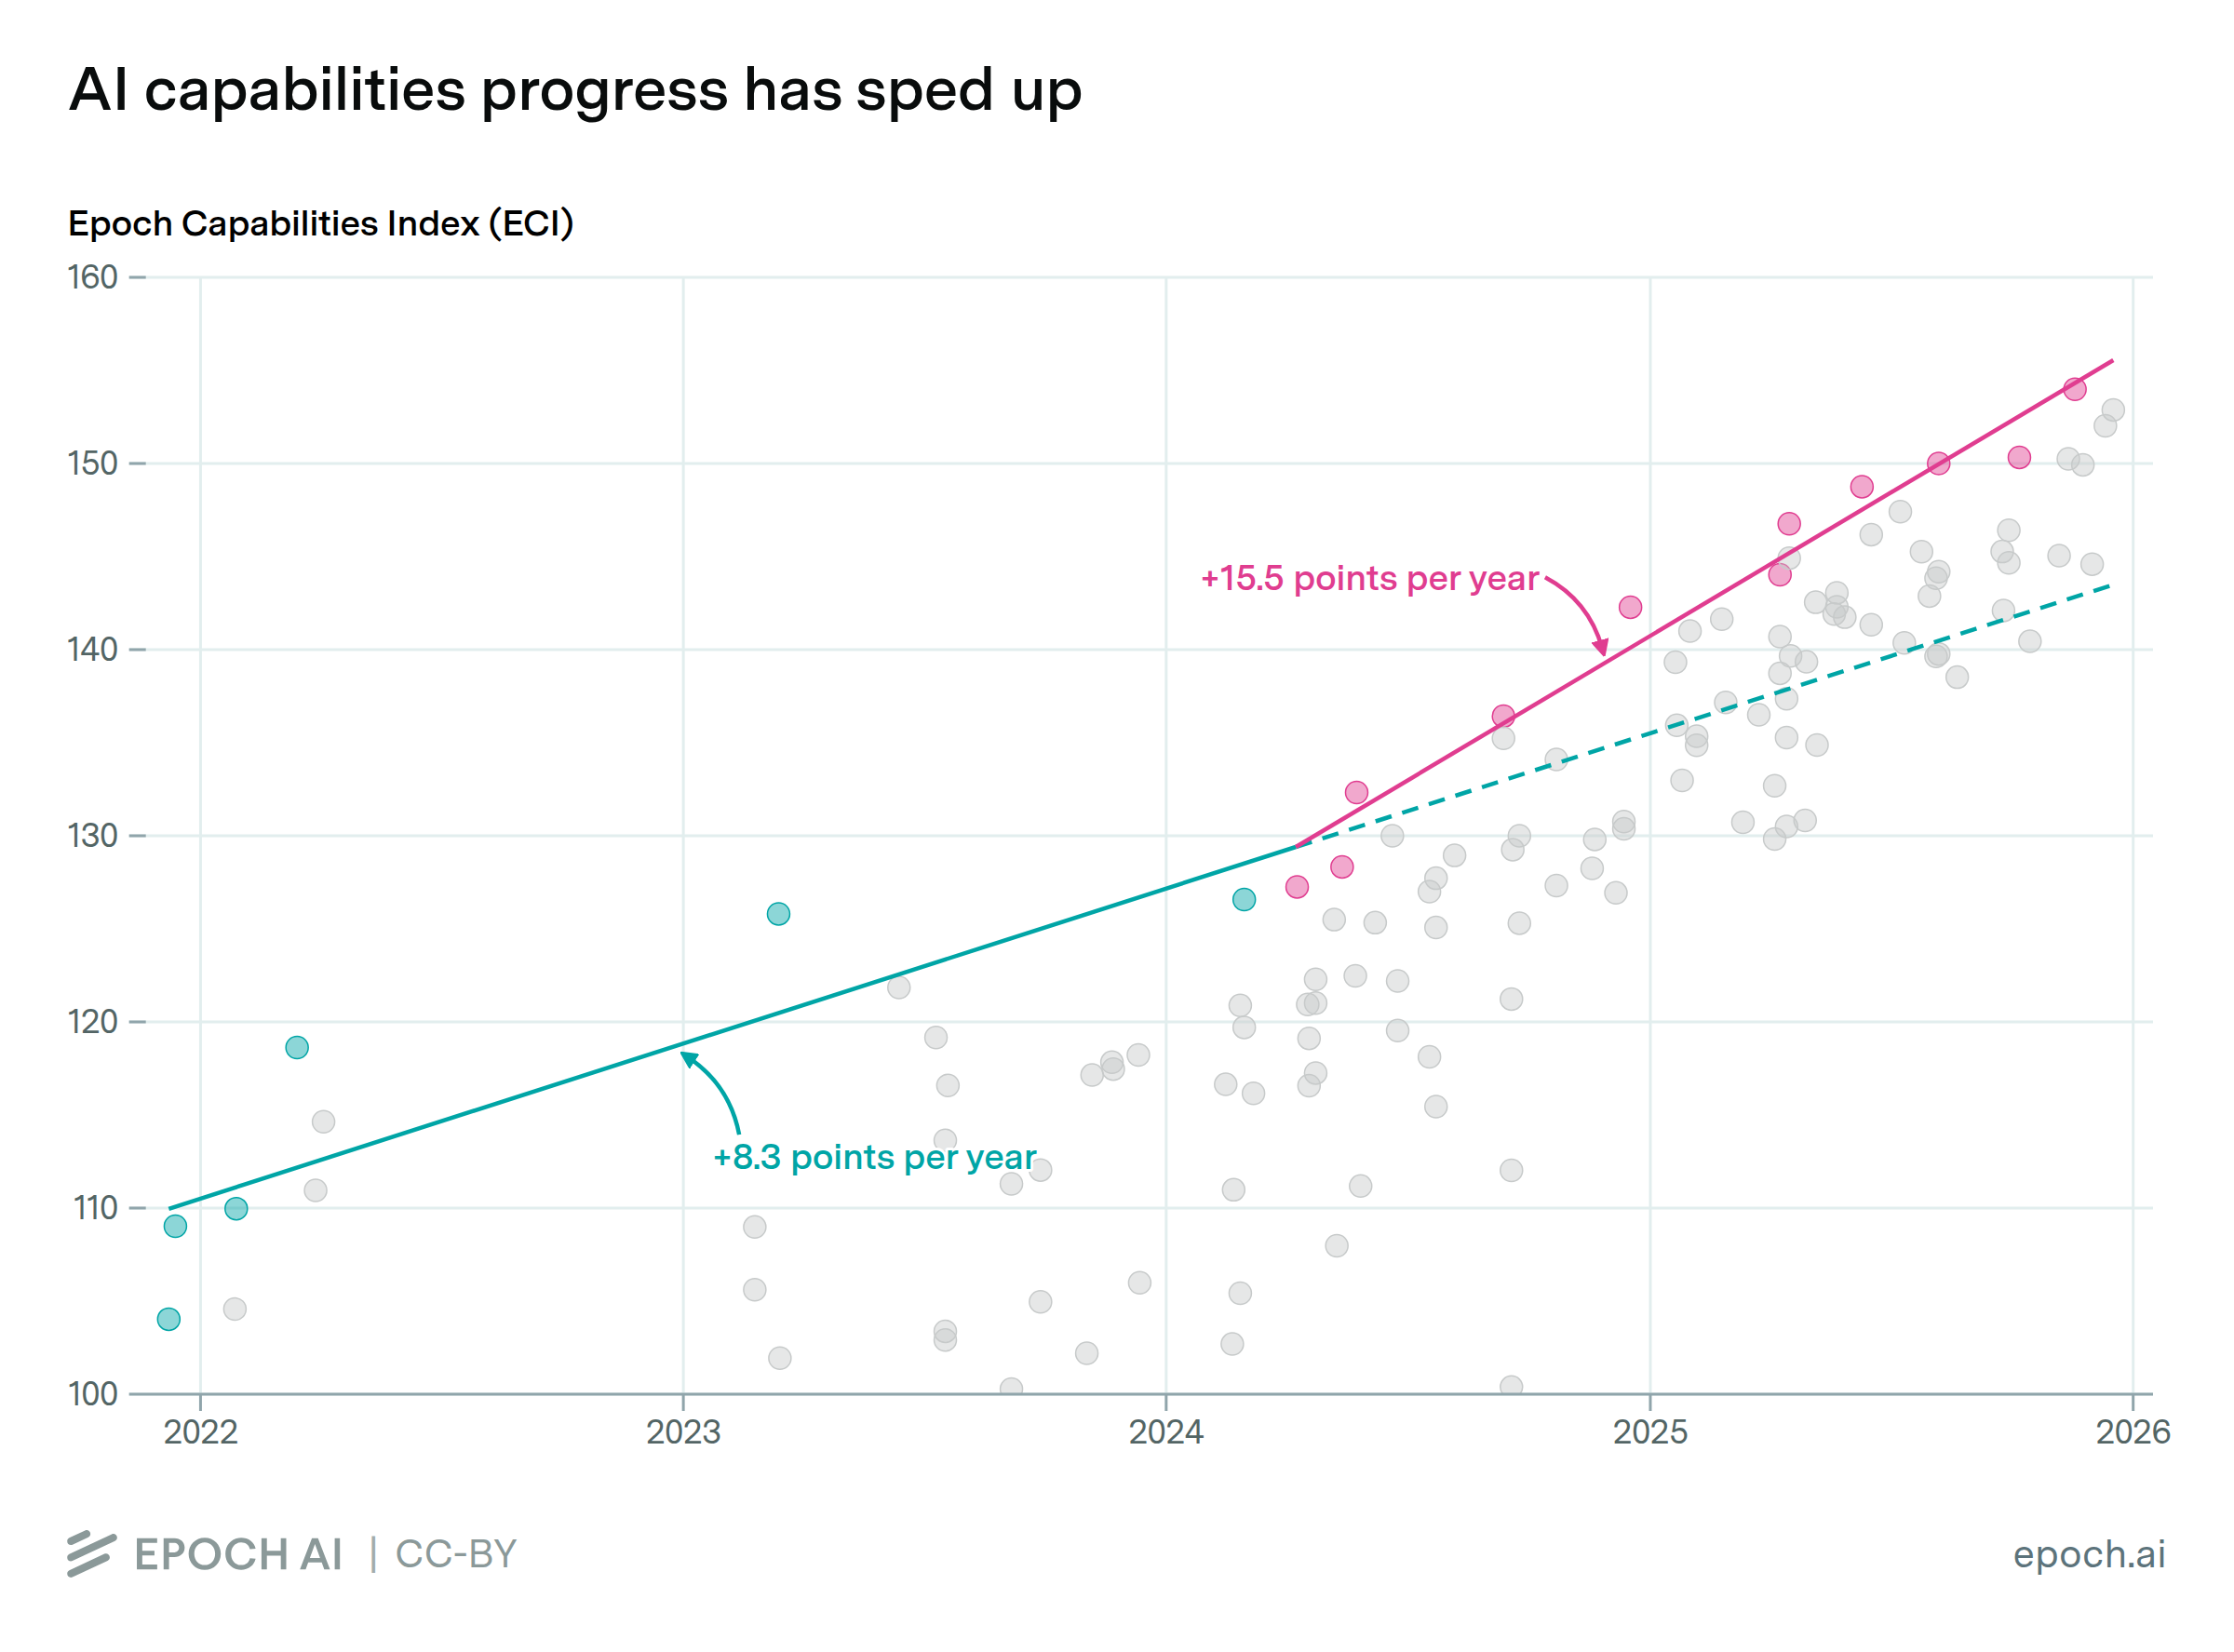
So the field does the next best thing and stitches many benchmarks together. Ihle walked us through Epoch AI’s Capability Index, which works roughly like this: Every model gets a single capability score on a logarithmic scale, where a fixed distance always means the same relative jump in ability. Every benchmark gets two numbers of its own: a difficulty, meaning where on that scale it starts to count, and a slope, meaning how wide a band of ability it can resolve before going blind at either end. Those are the same two properties as the sensor curve Ihle described earlier.
Then you fit all of it at once, every model and every benchmark together. The useful consequence is that no model needs to have been tested on every benchmark. As long as there is enough overlap to pin the scales to each other, the whole structure holds together.
What comes out is one continuous line, instead of a series of benchmarks that each climb steeply and then get saturated.
6. Progress measured with time horizons
The other approach to the same problem comes from METR: The idea is to stop scoring models against each other and start scoring them against people. Take a task and give it both to a model and to paid human experts. Measure how long the humans take. Now you can sort every task by a concrete difficulty rating: how many minutes or hours it takes a person.
On tasks that take a human a few seconds, a modern AI model succeeds nearly every time. On tasks that take a human ten hours, an older model almost never succeeds. Somewhere in between is the crossover point where the model succeeds about half the time, and that task length becomes the model’s time horizon.
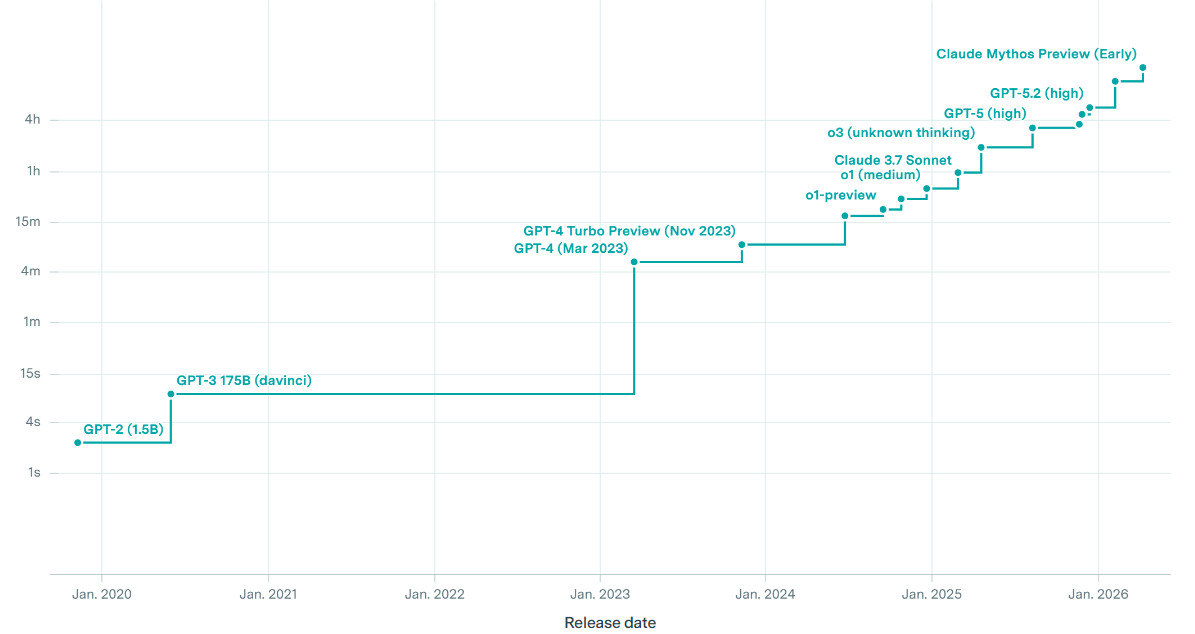
Traced back far enough we see that GPT-2 managed tasks measured in human seconds. The most capable current models at this day handle tasks that take a human expert several hours.
On METR’s tasks the original doubling time was around seven months. Then reasoning models arrived, and the rate roughly halved to about four months.
Even this measure is now running into the sensor problem it was built to solve. Short tasks are almost all solved, so the bottom of the curve is saturating. And extending it upward is expensive, because establishing that a task takes 100 hours means paying human experts to actually spend those 100 hours.
7. How long should we let the models work when benchmarking?
Older models had a natural ceiling. Give one a hard problem, let it work, give it more time and more tokens, and at some point it flattened out. It got stuck, went in circles, stopped improving. That plateau was convenient, because it meant the model had a score. You could say: this is what it can do.
Today’s best models do not do that. In Ihle’s description they just keep “grinding and grinding and grinding.” Give one ten times more compute and it does somewhat better. Give it ten times more again and it will sometimes still do better. The gains shrink each time, roughly logarithmically, but there is no obvious point at which you can declare the model finished.
If a model keeps improving for as long as you keep paying, then its benchmark score is not really a property of the model, but a property of your budget.
Should every model then get the same number of tokens? The same wall-clock time? The same amount of money? Each choice produces a different ranking, and none of them is obviously the right one. Some models can productively use ten million tokens on a single problem, while others give up early. Ihle does not think the field has settled this, and it is a large part of why he is cautious about headline doubling-time figures.
8. Why good scores can still mislead
Ihle is clear that benchmarks do work, up to a point. Scores correlate strongly with each other, and they correlate with how useful people find a model in practice. But only, in his words, “to a good degree, and absolutely not perfectly.” He has seen models post strong numbers that nobody thought were actually good to use.
Part of the reason is a bias built into benchmark design itself. The tasks that are easiest to build a good benchmark for tend to be the same tasks that are easiest to train a model on. So benchmarks are systematically weakest at measuring exactly the things models are worst at.
Then there is the incentive problem: Labs with large user bases have a second source of information: millions of real interactions telling them what people actually want and where the model actually fails. That gives them something to optimise for other than benchmark scores. A smaller or newer lab without an established product or enterprise customers has no such signal, and benchmark rankings are often its clearest route to attention.
Ihle describes the resulting behaviour, sometimes called benchmaxxing, as a continuous slope rather than a line between honest and dishonest. At one end, training directly on the test data, which he does not believe leading labs do deliberately. In the middle, building training environments that closely resemble known benchmark tasks. At the far, softest end, simply focusing your training on whatever is easiest to set up, which happens to correlate with whatever is easiest to benchmark.
9. So how should you read a number?
Most people will never design a benchmark. They just see a figure in a launch post or a chart on social media. What should they do with it?
Ihles first answer was that it is genuinely hard, even for him. A score in isolation carries very little. What makes it mean something is a reference point you have personally felt. If you remember how much better GPT-5 was than GPT-4 in your own daily use, then you have an anchor, and a ten-point move on some index can be translated into something real.
His second point is more useful and less obvious. On a chart like the time-horizon one, where exactly the vertical axis sits depends heavily on which tasks were chosen. Pick a different set of tasks and everything shifts up or down. But the slope, how fast the line climbs, is much less sensitive to that choice, that is the rate of change is the robust part of the measurement. So trust the trend more than the absolute value.
The third thing he offered was not really advice, just a description of his own habit, and it is something every person can do in their own field, where they have real expertise and can spot errors quickly.
Test it on what you actually know
Ihle takes cosmology papers he wrote years ago, work where he has real depth and can spot a wrong claim instantly, feeds them to a frontier model, and asks it to critique them.
What comes back is mixed in a very specific way. Some of the objections are good, the kind a sharp colleague would raise. Others are stated with exactly the same confidence and are simply wrong. When he pushes back on those, the model recognises the error straight away.
This gives him a way to look at the model’s capabilities against his own knowledge, making it easier to spot how capable it really is compared to just looking at a benchmark score.
He also warned about a trap in the opposite direction. It is easy to look at a brutally difficult benchmark, see a model doing well on it, and conclude we are nearly done. But the humans those tasks are calibrated against are usually specialists in exactly that narrow thing. Being competitive with a specialist on one narrow task is a long way from being broadly smarter than the best people across everything that matters. On that, he thinks there is still a good distance to go.
10. The bigger picture
Toward the end of our conversation, Ihle described the image of a tsunami. He described feeling like he can see it coming, the way you might spot a wave far out at sea, and trying to work out how far inland it will reach, aware that there is often a second and larger wave behind the first. Most people, he said, are going about their lives without a clear sense of how large the coming changes could be, even as more of them start to notice that something is approaching.
He is careful to point out that he is not speculating about the labs’ intentions here. Building systems smarter than humans across the board is their openly stated goal. He is taking them at their word and asking what follows from it.
What follows, in his view, is mainly a problem of control. The decisions shaping the world may start moving faster than human institutions can govern. Democratic processes, for instance, are slow by design. That is usually something good, but it stops being one when the thing you are trying to govern is compounding every few months.
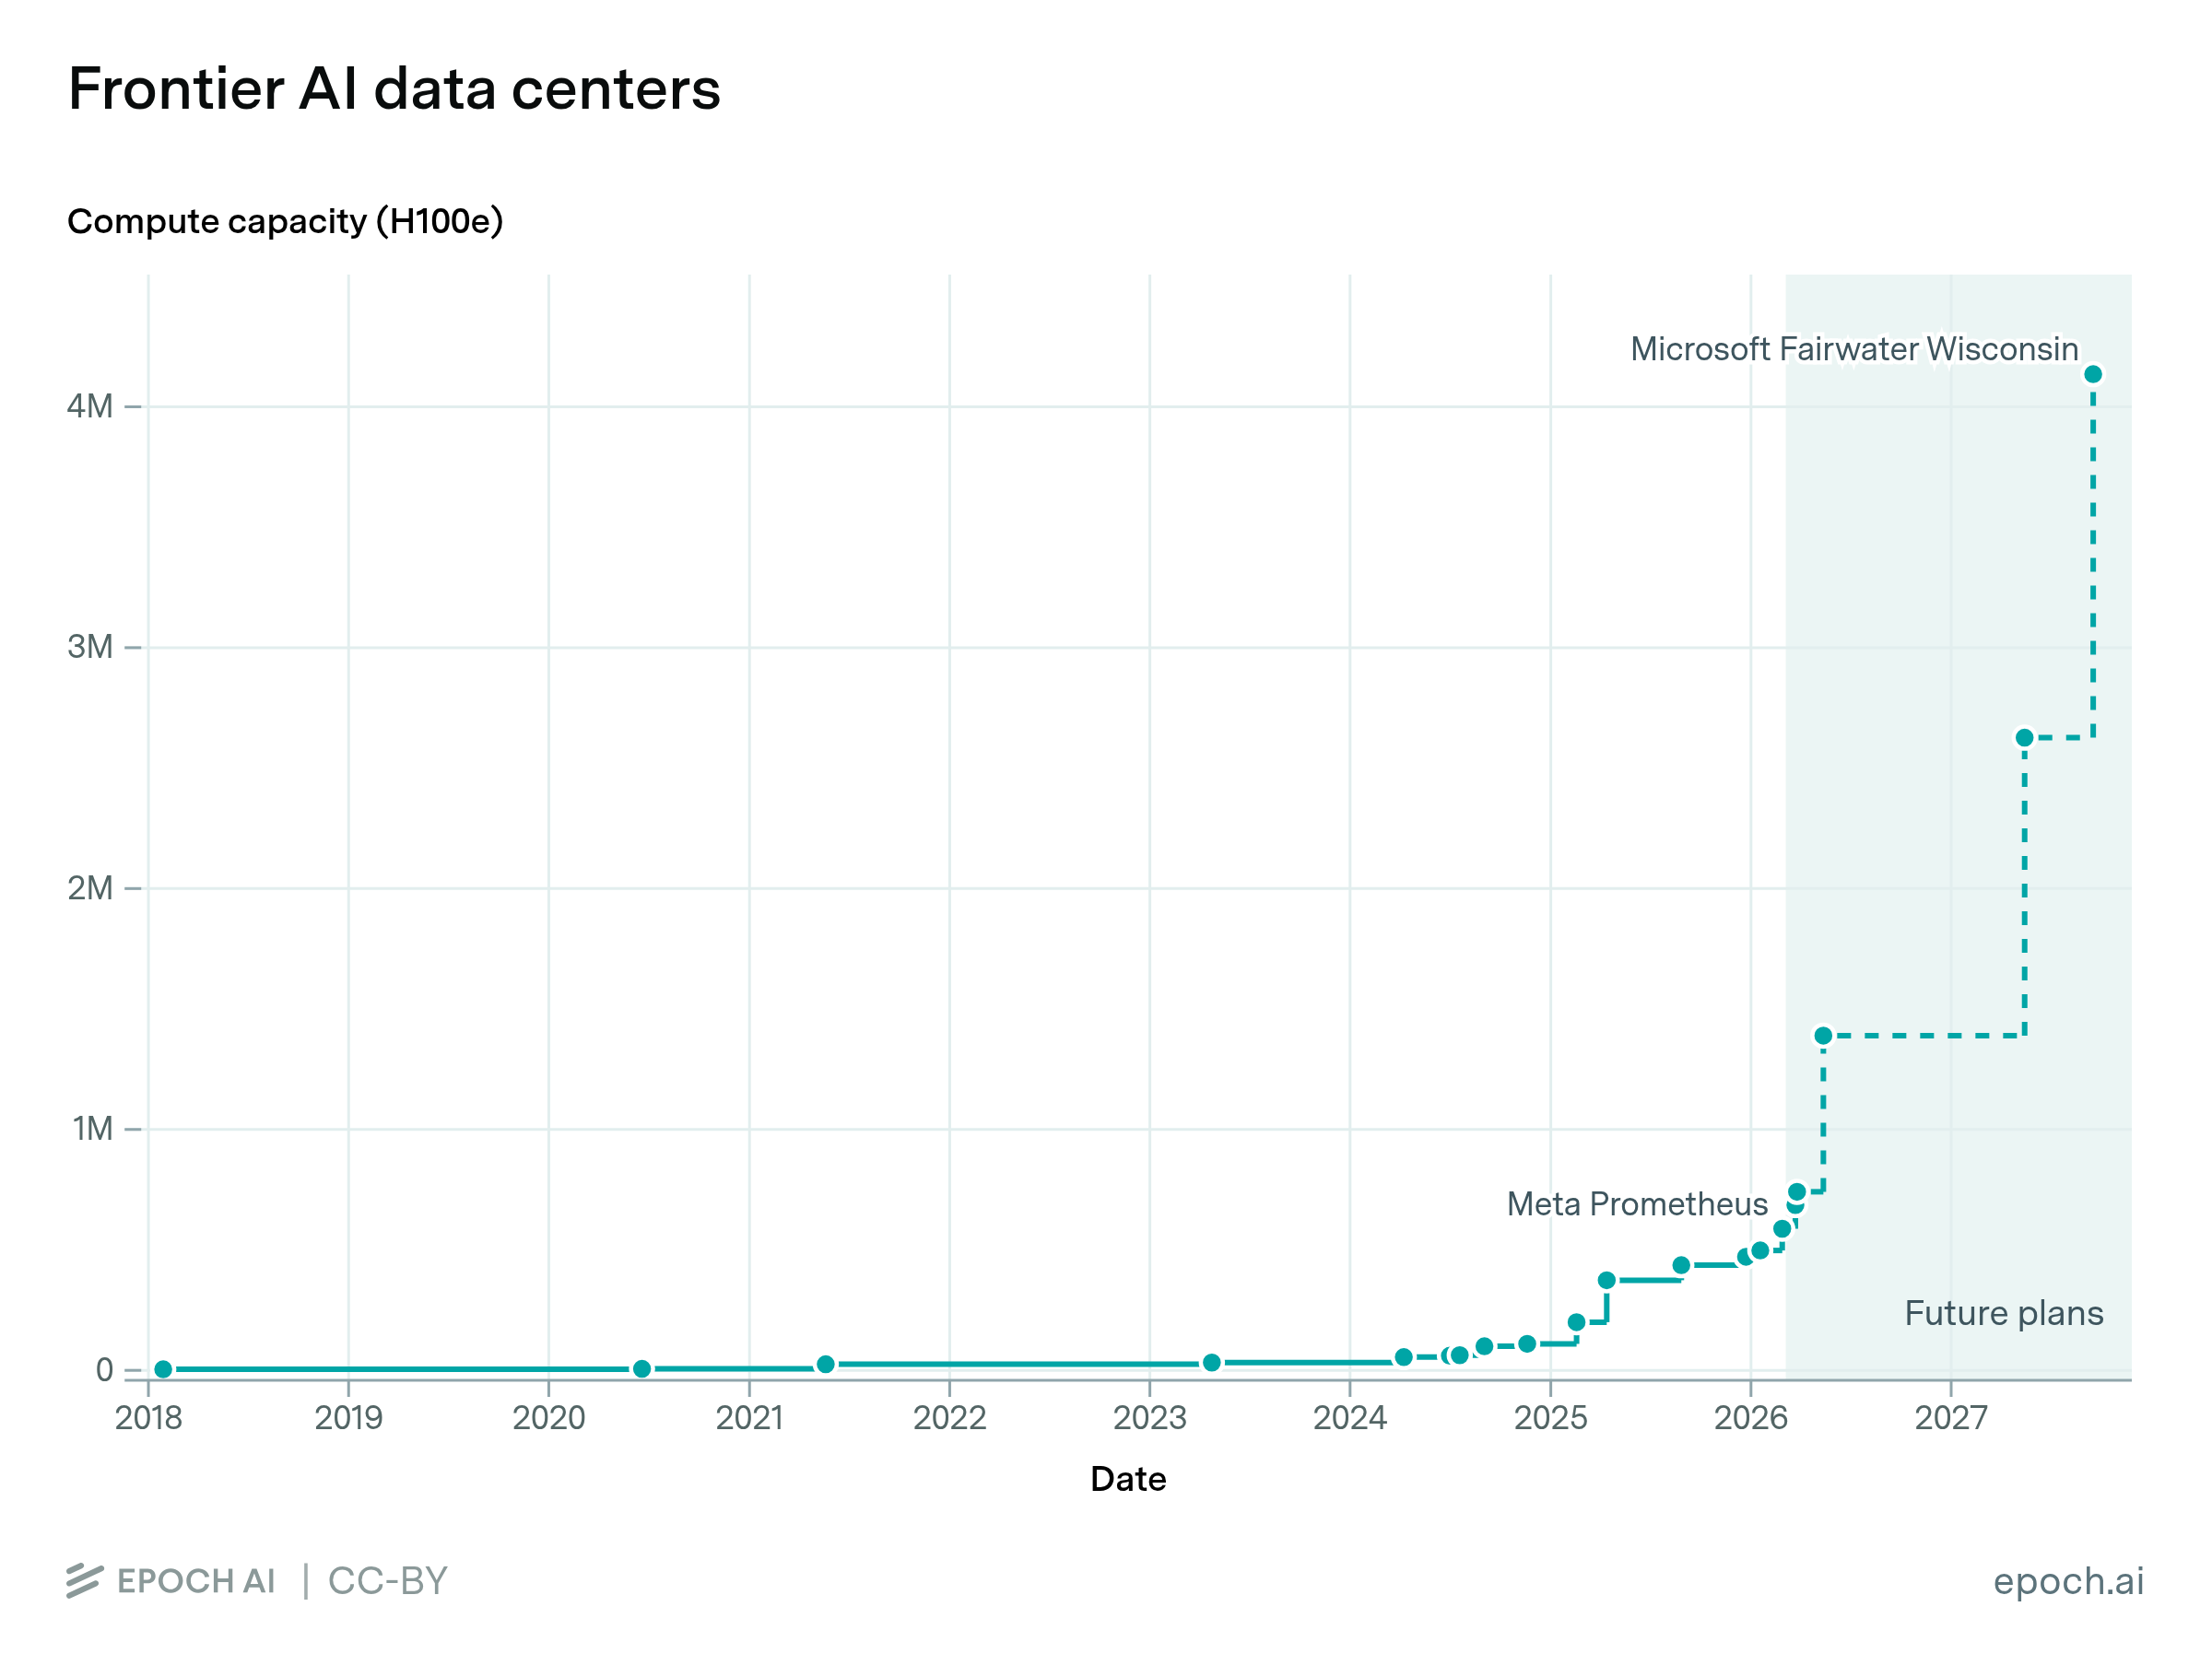
He does not think we are near a ceiling on capability either. There was a period, around GPT-4.5, when much bigger models seemed to stop paying off. More recently that reversed, and newer frontier models are again showing strong gains from scale, with labs reportedly moving toward systems in the range of one to two trillion parameters.
Training models that size needs hardware that has to be built years in advance, and that build-out is already well underway.
As a small sign of how seriously this is being taken outside AI itself, he mentioned a recent Fields Medal winner who has paused their own research to work on AI safety.
Ihle’s point is that the difference between a world where this arrives in one year and a world where it arrives in ten is not a small detail. It changes which policies are possible, which institutions have time to adapt, and what is worth doing right now. Working out which of those worlds we are in is a measurement problem, and it is the one he works on.
Asked about best and worst cases, he did not hedge. The broad class of bad outcomes is one where humanity loses control of decisions about its own future and becomes irrelevant to what happens next. The worst case within that is more specific, and he named it plainly: human extinction. He does not treat that as a remote tail scenario but as a genuinely real possibility. Best case, if models turn out to be genuinely aligned with human interests, the upside is enormous; real help with the largest problems we share. But he was clear on one thing: “we don’t automatically get that good future, we have to make it happen.” Getting that good future depends on how well we handle this crucial transition.
Look at the numbers yourself
WeirdML — Ihle’s own benchmark, with per-task results and the code the models wrote.
Epoch Capabilities Index — the stitched-together trend line from section 5.
METR time horizons — the task-length measure from section 6.
Note on AI usage: this article was written by Knut Opland Moen, with some AI assistance for transcribing the interview, structuring the draft and editing the prose. The opening image was generated with Nano Banana 3; the remaining charts are credited in their captions.